Beurer BF 100: 11. Analysing results
11. Analysing results: Beurer BF 100
Kcal
Calorie consumption
to delete anything, select “NO” and confirm with the
•
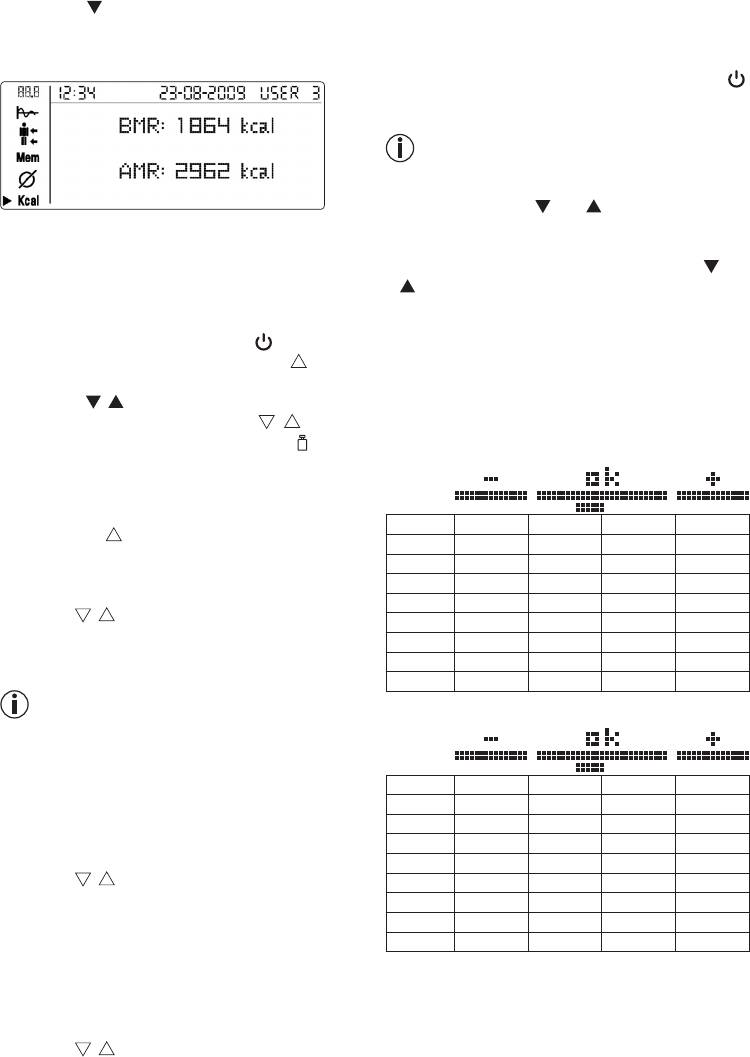
Press the [ ] button on the control unit to switch to
[SET] button.
the kcal screen. The theoretically calculated basal
Switching off the scale (standby mode)
metabolic rate (BMR) and active metabolic rate
•
Wait until the display automatically switches itself
(AMR) are shown in kcal.
off after approximately 45 seconds or press the [ ]
button on the control unit to switch the display off
manually.
Date and time can still be seen.
Power-saving mode
•
Press and hold the and menu buttons simul-
taneously for 10 seconds. The date and time disap-
Calling up the measurement memory from
pear.
standby
•
To switch back on again, press and hold the and
When the unit is switched off, the measurements from
menu buttons simultaneously for 10 seconds.
an analysis are automatically saved. There are 30 mem-
ory locations for each user.
11. Analysing results
•
Switch on the control unit with the [ ] button.
Body fat percentage
•
Select your user number by pressing the [ ] button.
The body fat values are displayed on the display and
To do so, press the button repeatedly if necessary.
analysed in the bar graph. The following body fat per-
•
Press the [ , ] buttons on the control unit to scroll
centages are guide values (contact your physician for
through the analysis values or the [ , ] buttons
further information).
to enter the submenus (e.g. switch to BF,
).
Man
Deleting details
1. Deleting a user and all settings and saved values
•
Switch the device on and select your user number by
Age low normal high very high
pressing the [ ] button. To do this, press the button
10 –14 <11 % 11–16 % 16.1– 21 % >21.1 %
repeatedly and confirm with [SET].
15 –19 <12 % 12 –17 % 17.1– 22 % >22.1 %
•
When 0.0 appears on the display, press and hold the
20 – 29 <13 % 13 –18 % 18.1– 23 % >23.1 %
[SET] button for 5 seconds to delete the user.
30 – 39 <14 % 14 –19 % 19.1– 24 % >24.1 %
•
Use the [ , ] buttons to select “YES” and confirm
40 – 49 <15 % 15 – 20 % 20.1– 25 % >25.1 %
the prompt with the [SET] button. If you do not wish
50 – 59 <16 % 16 – 21 % 21.1– 26 % >26.1 %
to delete the user, select “NO” and confirm with the
60 – 69 <17 % 17 – 22 % 22.1– 27 % >27.1 %
[SET] button.
70 –100 <18 % 18 – 23 % 23.1– 28 % >28.1 %
All saved values and settings for this user are de-
Woman
leted.
2. Deleting individual saved values for a user
•
From the “Mem” measurement memory, select a
Age low normal high very high
measurement and briefly press the [SET] button on
10 –14 <16 % 16 – 21 % 21.1– 26 % >26.1 %
the control unit to delete the displayed value from
15 –19 <17 % 17 – 22 % 22.1– 27 % >27.1 %
the memory. You can also do this immediately after
20 – 29 <18 % 18 – 23 % 23.1– 28 % >28.1 %
the measurement has been taken.
30 – 39 <19 % 19 – 24 % 24.1– 29 % >29.1 %
•
Use the [ , ] buttons to select “YES” and confirm
40 – 49 <20 % 20 – 25 % 25.1– 30 % >30.1 %
the prompt with the [SET] button. If you do not wish
50 – 59 <21 % 21– 26 % 26.1– 31 % >31.1 %
to delete the value, select “NO” and confirm with the
60 – 69 <22 % 22 – 27 % 27.1– 32 % >32.1 %
[SET] button.
70 –100 <23 % 23 – 28 % 28.1– 33 % >33.1 %
3. Deleting all saved values for a user
A lower value is often found in athletes. Depending on
•
Call up the “Mem” measurement memory and press
the type of sports, training intensity and physical con-
and hold the [SET] button on the control unit for ap-
stitution, values may result which are below the rec-
proximately 3 seconds to delete all the values.
ommended values stated. It should, however, be noted
•
Use the [ , ] buttons to select “YES” and confirm
that there could be a danger to health in the case of
the prompt with the [SET] button. If you do not wish
extremely low values.
21
Body water percentage
Bone mass
The body water percentage is normally within the fol-
Like the rest of our body, our bones are subject to the
lowing ranges:
natural development, degeneration and ageing pro-
cesses. Bone mass increases rapidly in childhood and
Man
reaches its maximum between 30 and 40 years of age.
Bone mass reduces slightly with increasing age. You
can reduce this degeneration somewhat with healthy
Age poor good very good
nutrition (particularly calcium and vitamin D) and reg-
10 –100 <50 % 50 – 65 % >65 %
ular exercise. With appropriate muscle building, you
can also strengthen your bone structure. Note that this
Woman
scale will not show you the calcium content of your
bones, but will measure the weight of all bone constit-
uents (organic substances, inorganic substances and
Age poor good very good
water). Little influence can be exerted on bone mass,
10 –100 <45 % 45 – 60 % >60 %
but it will vary slightly within the influencing factors
Body fat contains relatively little water. People with a
(weight, height, age, gender).
high proportion of body fat may therefore have a pro-
There are no recognised guidelines or recommenda-
portion of body water below the guideline values. With
tions relating to bone mass measurement.
endurance athletes, however, the recommended val-
Important
ues could be exceeded due to low fat percentages and
high muscle percentage.
Please do not confuse bone mass with bone density.
This scale is unsuitable for measuring body water in
Bone density can be determined only by means of a
order to draw medical conclusions concerning age-
medical examination (e.g. computer tomography, ultra-
related water retention, for example. If necessary ask
sound). It is therefore not possible to draw conclusions
your physician. Basically, a high body water percent-
concerning changes to the bones and bone hardness
age should be the aim.
(e.g. osteoporosis) using this scale.
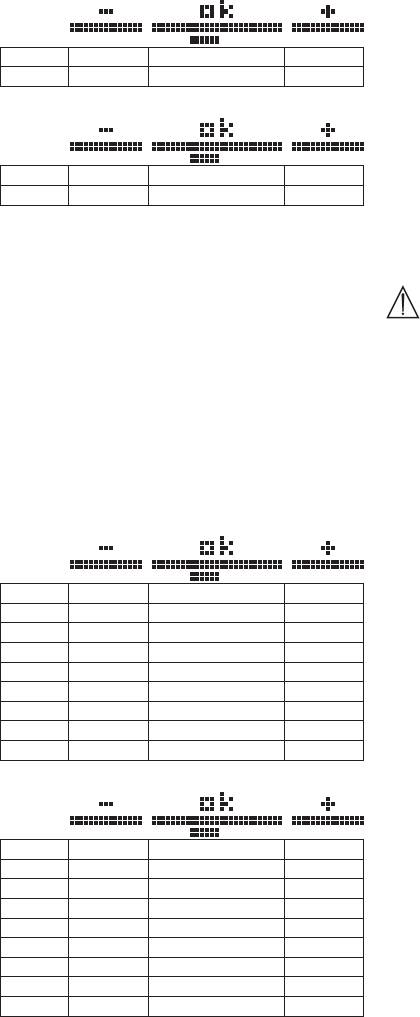
Proportion of muscle
BMR
The muscle percentage is normally within the follow-
The basal metabolic rate (BMR) is the amount of ener-
ing ranges:
gy which the body requires to maintain its basic func-
tions when completely at rest (sufficient for e.g. lying
Man
in bed for a period of 24 hours). This value essentially
depends on weight, height and age. The diagnostic
scale displays this in kcal/day and calculates it using
Age low normal high
the scientifically recognised Harris Benedict formula.
10 –14 <44% 44 – 57 % >57 %
This is the amount of energy that your body requires as
15 –19 <43% 43 – 56 % >56 %
an absolute minimum which must be supplied to the
20 – 29 <42% 42 – 54 % >54 %
body in the form of food. If you consume less energy
30 – 39 <41% 41– 52 % >52 %
than this in the long term, it can have a detrimental ef-
40 – 49 <40% 40 – 50 % >50 %
fect on your health.
50 – 59 <39% 39 – 48 % >48 %
60 – 69 <38% 38 – 47 % >47 %
AMR
70 –100 <37% 37 – 46 % >46 %
The active metabolic rate (AMR) is the amount of ener-
gy required daily by the body in its active state. The en-
Woman
ergy consumption of a human being rises with increas-
ing physical activity and is measured on the diagnostic
scale in relation to the degree of activity entered (1 – 5).
Age low normal high
To maintain your existing weight, the amount of energy
10 –14 <36% 36 – 43 % >43 %
used must be reintroduced into the body in the form
15 –19 <35% 35 – 41 % >41 %
of food and drink. If less energy is introduced than is
20 – 29 <34% 34 – 39 % >39 %
used over a longer period of time, your body will obtain
30 – 39 <33% 33 – 38 % >38 %
the difference largely from the amount of fat stored and
40 – 49 <31% 31– 36 % >36 %
your weight will decrease. If, on the other hand, over a
50 – 59 <29% 29 – 34 % >34 %
longer period of time more energy is introduced than
60 – 69 <28% 28 – 33 % >33 %
the total active metabolic rate (AMR) calculated, your
70 –100 <27% 27 – 32 % >32 %
22
Оглавление
- DEUTSCH
- 3. Sicherheitshinweise
- 6. Montage des Bedienteils
- 7. Informationen
- 8. Einstellung
- 10. Bedienung
- 11. Ergebnisse bewerten
- 12. Messwerte zu einem PC 15. Entsorgen übertragen / HealthManager /
- 17. Technische Angaben
- ENGLISH
- 4. Description of the unit
- 5. Initial use
- 7. Information
- 8. Setting
- 10. Operation
- 11. Analysing results
- 13. Replacing batteries
- 16. What if there are problems?
- FRANÇAIS
- 3. Consignes de sécurité
- 6. Montage de l’unité de
- 7. Informations
- 8. Réglage
- 10. Utilisation
- 11. Interprétation des résultats
- 13. Remplacement des piles
- 16. Que faire en cas de
- 17. Caractéristiques techniques
- ESPAÑOL
- 3. Indicaciones de seguridad
- 6. Montaje del panel de mando
- 7. Información
- 8. Configuración
- 10. Manejo
- 11. Evaluación de los resultados
- 15. Eliminación
- 17. Características técnicas
- ITALIANO
- 4. Descrizione dell’apparecchio
- 6. Montaggio del pannello di
- 7. Informazioni
- 8. Impostazioni
- 10. Funzionamento
- 11. Valutazione dei risultati
- 12. Trasmissione dei valori misurati 15. Smaltimento su un PC / HealthManager /
- 17. Dati tecnici
- TÜRKÇE
- 4. Cihaz açıklaması
- 5. Çalıştırma
- 7. Bilgiler
- 8. Ayar
- 10. Kullanım
- 11. Sonuçların değerlendirilmesi
- 13. Pillerin değiştirilmesi
- 16. Problemle karşılaşılması
- РУССКИЙ Оглавление 1. Для ознакомления
- 2. Пояснения к символам
- 4. Описание прибора
- 6. Монтаж пульта управления
- 8. Настройка
- 9. Показания на дисплее
- 11. Оценка результатов
- 12. Перенос результатов
- 17. Технические данные
- 18. Гарантия
- POLSKI
- 3. Wskazówki dotyczące
- 6. Montaż panelu obsługi
- 7. Informacje
- 8. Ustawienia
- 10. Obsługa
- 11. Ocena wyników
- 14. Czyszczenie i konserwacja
- 16. Co robić w przypadku


