Beurer PS45: 6. Evaluation of results Body mass index (BMI) Man < 20 years Woman < 20 years Man / Woman ≥ 20 years
6. Evaluation of results Body mass index (BMI) Man < 20 years Woman < 20 years Man / Woman ≥ 20 years: Beurer PS45
Table of contents
- 1. Getting to know your instrument 2. Safety notes 3. Unit description
- 4. Initial use 5. Operation
- 6. Evaluation of results Body mass index (BMI) Man < 20 years Woman < 20 years Man / Woman ≥ 20 years
- 7. Storage and maintenance 8. Disposal
- 9. What if there are problems?
b. Weighing yourself and calculating BMI
•
Using the buttons, select the user memory space where your settings have been
saved.
•
Wait until “
0.0
kg” is displayed again. You can now use the scale. Stand still whilst
weighing yourself.
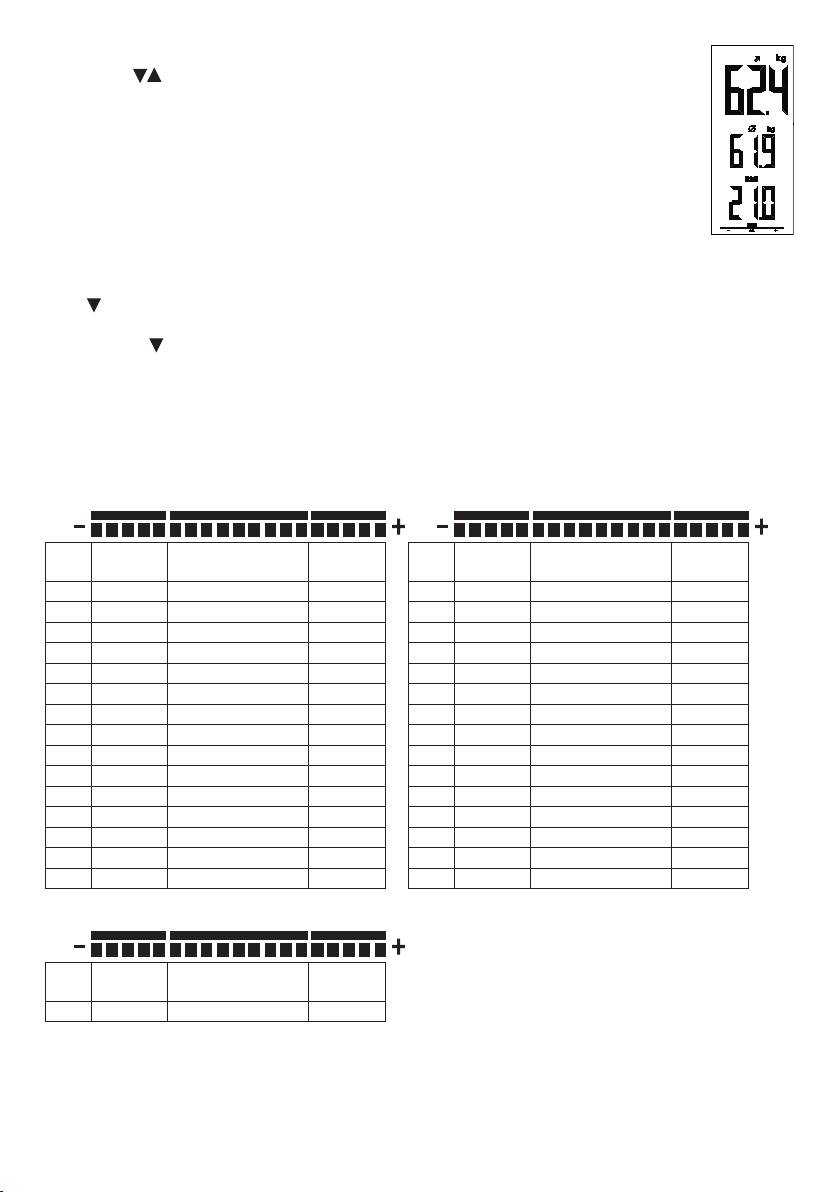
The weight is displayed with trend, average weight and BMI with interpretation (Fig. 3).
The scale switches itself o after approx. 15 seconds.
Accessing saved measurements
Fig. 3
After a measurement with BMI calculation, your last 5 measurements can be displayed.
•
After a BMI calculation, browse through the memory spaces for the measurements one by one using
the
button. Top: current weight; Middle: last weight; Bottom: memory space.
If no values are saved, no average value is displayed.
•
By pressing again, the current weight, average weight and BMI are shown again.
6. Evaluation of results
Body mass index (BMI)
The body mass index (BMI) is a number that is often called upon to evaluate body weight. The number
is calculated from body weight and height, the formula is – body mass index = body weight : height².
The measurement unit for BMI is [kg/m²].
Man < 20 years Woman < 20 years
Age Under-
Normal weight Over-
Age Under-
Normal weight Over-
weight
weight
weight
weight
5 12,1 – 14,0 14,1–16,5 16,6 – 20,2 5 11,8 – 13,8 13,9 –16,8 16,9 – 21,3
6 12,1 – 14,0 14,1–16,7 16,8 – 20,7 6 11,7 – 13,8 13,9 –16,9 17,0 – 22,1
7 12,2 – 14,1 14,2 –16,9 17,0 – 21,6 7 11,8 – 13,8 13,9 –17,2 17,3 – 23,3
8 12,4 – 14,3 14,4 –17,3 17,4 – 22,8 8 11,9 – 14,0 14,1–17,6 17,7 – 24,8
9 12,6 – 14,5 14,6 –17,8 17,9 – 24,3 9 12,1 – 14,3 14,4 –18,2 18,3 – 26,5
10 12,8 – 14,8 14,9 –18,4 18,5 – 26,1 10 12,4 – 14,7 14,8 –18,9 19,0 – 28,4
11 13,1 – 15,2 15,3 –19,1 19,2 – 28,0 11 12,7 – 15,2 15,3 –19,8 19,9 – 30,2
12 13,4 – 15,7 15,8 –19,8 19,9 – 30,0 12 13,2 – 15,9 16,0 – 20,7 20,8 – 31,9
13 13,8 – 16,3 16,4 – 20,7 20,8 – 31,7 13 13,6 – 16,5 16,6 – 21,7 21,8 – 33,4
14 14,3 – 16,9 17,0 – 21,7 21,8 – 33,1 14 14,0 – 17,1 17,2 – 22,6 22,7 – 34,7
15 14,7 – 17,5 17,6 – 22,6 22,7 – 34,1 15 14,4 – 17,7 17,8 – 23,4 23,5 – 35,5
16 15,1 – 18,1 18,2 – 23,4 23,5 – 34,8 16 14,6 – 18,1 18,2 – 24,0 24,1 – 36,1
17 15,4 – 18,7 18,8 – 24,2 24,3 – 35,2 17 14,7 – 18,3 18,4 – 24,4 24,5 – 36,3
18 15,7 – 19,1 19,2 – 24,8 24,9 – 35,4 18 14,7 – 18,5 18,6 – 24,7 24,8 – 36,3
19 15,9 – 19,5 19,6 – 25,3 25,4 – 35,5 19 14,7 – 18,6 18,7 – 24,9 25,0 – 36,2
Man / Woman ≥ 20 years
Age Under-
Normal weight Over-
weight
weight
≥ 20 16,0 – 18,4 18,5 – 24,9 25,0 – 40,0
Source: Bulletin of the World Health Organization 2007;85:660-7; Adapted from WHO 1995, WHO 2000 and WHO 2004.
9
